A modular analytics dashboard that turns raw CKAN activity into metrics your whole team can use.
This article is co-authored by Oleksandr Cherniavskyi, the creator of ckanext-better-stats.
If you are running a CKAN data portal without clear analytics, you are working with limited visibility. Datasets are published, organisations contribute, and users register, but the numbers behind this activity are often scattered and hard to read in one place. You know things are happening. But you cannot always see how much, how often, or how well.
Link Digital’s new Better Stats extension for CKAN closes that gap.
What Better Stats is
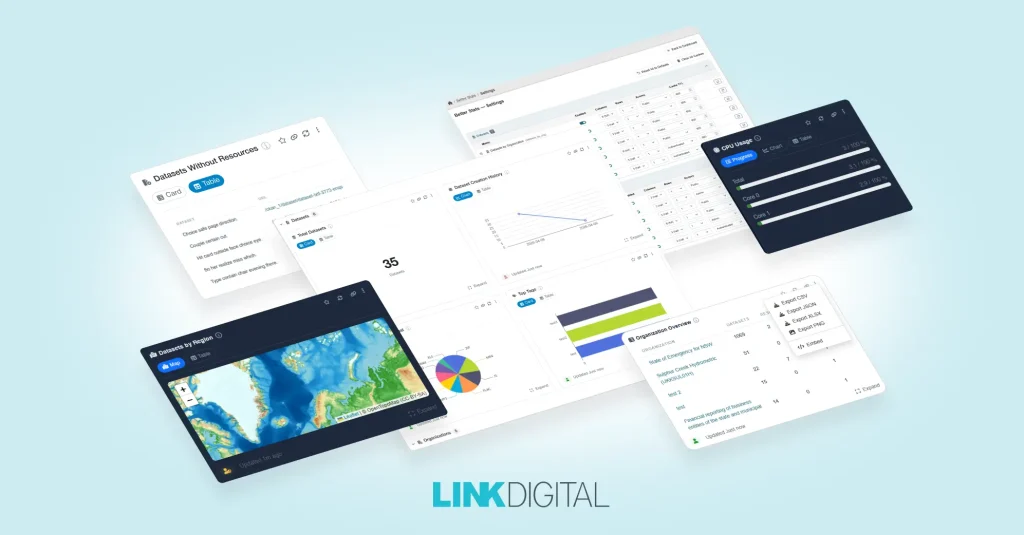
Better Stats is a modular CKAN extension that collects, processes, and visualises portal statistics. Each metric manages its own data retrieval, access control, caching, and rendering, so your analytics stay flexible and are not tied to a single visualisation backend. The result is a dashboard that is available to data administrators or custodians managing your portal, and each metric can be configured for the public, authenticated, or administrator access.
Key features
- 18 built-in metrics across datasets, organisations, users, and system health
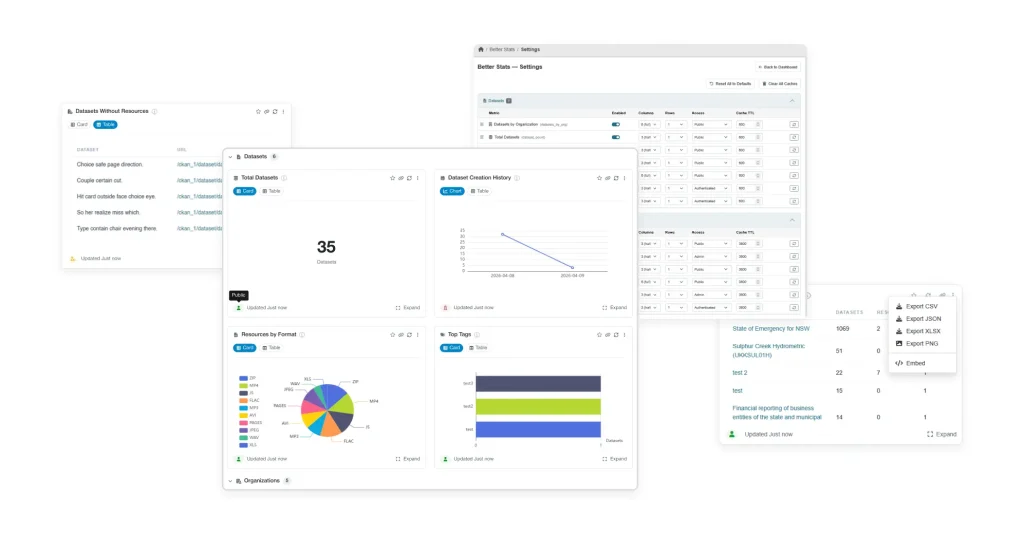
- Four visualisation types: cards, charts, progress bars, and tables
- Export options: CSV, JSON, XLSX and image, for reports and dashboards
- Data quality monitoring: completeness scores, stale datasets, datasets without resources, and inactive organisations
- Role-based access: each metric is set to public, authenticated, or admin
- Embeddable metrics: copy an embed code to place any metric on its own page
- Redis caching with configurable refresh, plus one-click refresh on any card
- Extensible by design: register your own metrics through signals, without changing core code
What you can track
| Category | Example metrics |
| Datasets | Total datasets, datasets by organisation, completeness percentage, creation history, resources by format, top tags, datasets without resources, stale datasets |
| Organisation | Organisation count and trend, sizes, hierarchy, membership levels, an organisation overview leaderboard, inactive organisations |
| Users | Registered users and registration trend |
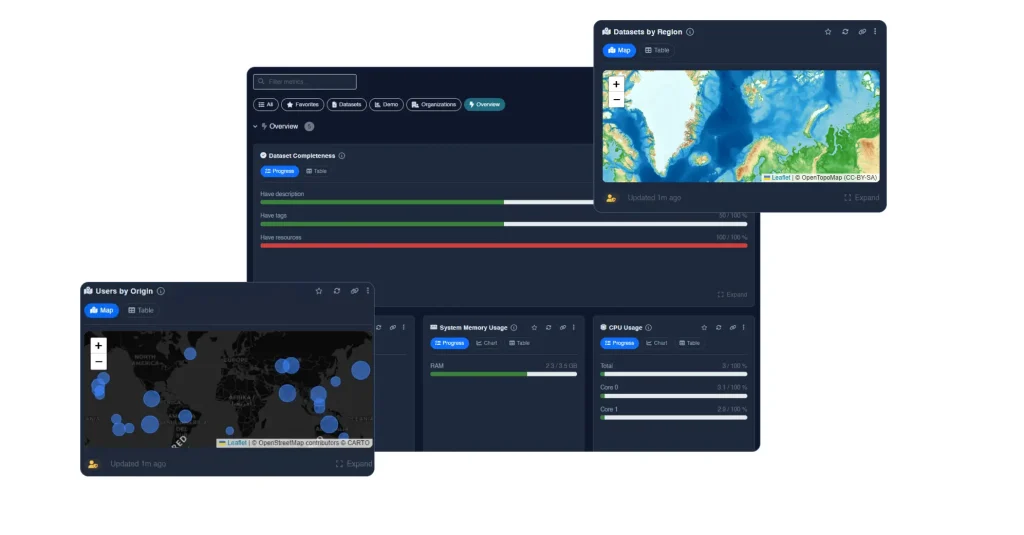
| System | CPU usage, memory usage, disk usage |
Built for teams: security and personalisation
Not all data should be public, and not all users need the same dashboard. Better Stats introduces granular control and personalisation to your CKAN analytics:
- Role-Based Metrics While the main dashboard is accessible to everyone, individual metrics can be finely tuned. You can configure specific insights for public viewing, authenticated users, or administrator-only access. These settings are applied in real-time, giving portal teams ultimate control over what is shared and with whom.
- Favorite Metrics Analytics should be relevant. Authenticated users can pin their own “Favorite Metric,” creating a highly personalized dashboard experience the moment they log in.
Stop guessing and start measuring
Data portals are only as valuable as the insight they provide, and that insight matters as much to the teams running the portal as it does to the public using it. Better Stats gives portal teams a clear, configurable view of activity, quality, and health in one place.
Get started
Read the documentation at datashades.github.io/ckanext-better-stats, or view the source on GitHub at github.com/DataShades/ckanext-better-stats.