An interview with Maeva Tesan, Information, Communication and Knowledge Management Officer, Pacific Data Hub and Pacific Community Centre for Ocean Science
Every data portal faces unique challenges in fulfilling its mission. This is certainly the case with the Pacific Data Hub, an open data portal that serves as a gateway to the most comprehensive data collection relevant to the 22 Pacific Island nations and seeks to make it easily available to as wide an audience as possible, including government decision-makers, Pacific civil society and business organisations, and researchers.
Who oversees the Pacific Data Hub
The Hub is overseen by the Pacific Community (SPC), the principal scientific and technical organisation supporting development in the Pacific region. SPC is the custodian of over seven decades of Pacific-related data, including population census, household survey, and geospatial data. In addition to the Pacific states, the Hub also harvests data from the SPC’s metropolitan members and multilateral organisations. The Hub, which began with the assistance of Link Digital in February 2018, is a crucial data management tool that now hosts close to 800 datasets from across the region. It is also the centre of a growing ecosystem of data products, websites and interactive dashboards, some of which Link Digital has worked on.
Those working on the Hub must deal with complex questions around data stewardship and differing levels of data literacy across a geographically and culturally complex region. One is Information, Communication and Knowledge Management Officer, Maeva Tesan. She is responsible for two websites that are connected to – but not directly integrated within – the Pacific Data Hub: the Climate Change Flagship and the Pacific Community Centre for Ocean Science (PCCOS). While each serves a different purpose, they are linked through shared goals of improving access to reliable data. In the first two-part series on the Hub’s work, Tesan discussed some of the data management issues and challenges related to her work.
A lack of a common data protocol
The Climate Change Flagship website is designed as a comprehensive resource on climate-related issues, covering impacts, adaptation, finance, advocacy, and SPC’s key areas of work in this field. It is also designed, according to Tesan,
as a strategic framework to enhance SPC’s climate change work and a means of gathering all the relevant data in one easy-to-navigate site.
For now, she says,
information related to the Climate Change Flagship website is mainly text-based, explaining what climate change is and what SPC is doing in this space regarding climate change projects. It does not gather datasets like the Hub does from external partners.
While the site currently focuses on providing explanatory information, it does not yet integrate datasets from external partners, unlike the Pacific Data Hub. This limitation reflects a broader challenge across the region: climate-related data and statistics are often fragmented, incomplete, and dispersed across multiple locations and stakeholders.
In contrast, the Pacific Community Centre for Ocean Science (PCCOS) was created at the specific request of SPC’s members, who wanted a central location to host ocean-related science data. This includes a range of related projects aimed at helping decision-makers and communities make more informed decisions about sustainable ocean management and an ocean catalogue containing detailed scientific data.
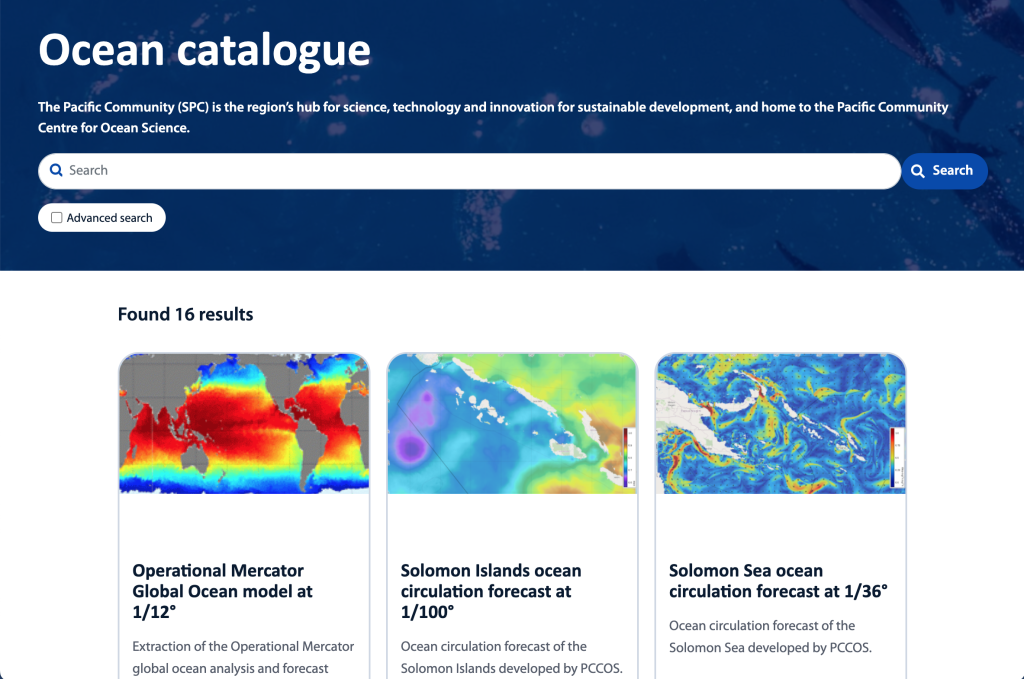
The idea was to have one single webpage where you could access all this data,
says Tesan.
When you click on it, you can have access to data produced by SPC or its partners. If there is any project where people are working with SPC and want it to be reflected in the Ocean catalogue, we can easily add it. Before the Ocean Catalogue, anything relating to a topic like ocean circulation was spread across different websites and was hard to find. Only the person who owned the data knew where it was.
There are protocols that govern the process of sharing data on the PCCOS.
There needs to be an agreement between SPC and the agencies.
There are also different levels of data access.
Only data with clear management and governance protocols can be publicly shared.
One central challenge in administering the Climate Change Flagship and PCCOS websites is the lack of a common framework for data sharing and governance throughout the Pacific region.
Every data produced is supposed to be used by every country and every organisation. But SPC doesn’t have the same data governance as the Secretariat of the Pacific Regional Environmental Program, the Forum Fisheries Agency or the government of Kiribati, etc. In the region, the data sharing agreements differ from organisation to organisation and country to country, depending on their particular data regime and what both parties agree to. There is no common framework or rule for this.
According to Tesan, websites like PCCOS are a mechanism for building data capability across the region.
With the Ocean Catalogue, for example, we aimed to adhere to the standardised format and method for sharing heavy datasets, requiring significant data infrastructure and robust servers to host. This remains a complex challenge in the Pacific: when valuable ocean data is developed, sharing it demands significant technical capacity and reliable hosting solutions, which are often limited.
Getting data into the hands of those who can use it
Another major issue for Tesan is ensuring that the data hosted on sites such as the Climate Change Flagship and PCCOS websites is not simply sitting there but is being put into the hands of people who can use it.
One of the biggest challenges for me was creating a platform that could truly speak to everyone,
says Tesan, referring to the Climate Change Flagship website.
Too often, websites related to science are shaped by the mindset of project managers, usually leaning toward the project management perspective. With the Climate Change Flagship, we tried to find a balance. The website includes technical information on complex topics like mitigation and adaptation, but it’s designed to work for both climate experts, through the climate change dimensions section, and for the wider public, through the projects by country section. Creating a site that speaks to both groups is a big challenge, especially involving scientific data.
Clear labelling and naming conventions are important to the solution, so websites can be more easily navigated and understood. Presenting the data visually is another. A successful example of the latter that Tesan is keen to highlight is the Flagship’s Pacific Climate Change Project’s Map. A partnership between SPC and Link Digital, it uses Drupal, a highly flexible open source content management system, to create an interactive map that enables the user to quickly get country-specific data on all climate-related projects underway across the Pacific.
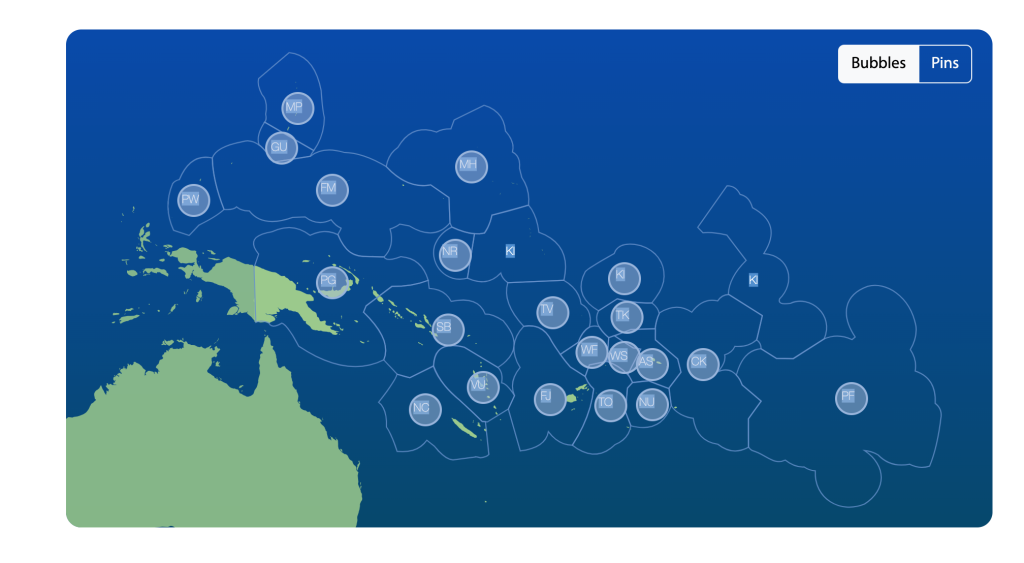
It was easy and quick to create and, even though it has more than a hundred different projects, I think it is quite clear. This map is something that everyone can understand. What was hard was to find the balance between being technical enough for the technical people and good enough for the wider public.
Other examples of making information on the Climate Change Flagship website more accessible are its section on Impact Stories—examples of how climate change is being felt and dealt with in the Pacific—and the Publications section, which has downloadable plain-language fact sheets to explain aspects of the SPC’s climate change work. As evidence of their impact, Tesan cites the fact that stakeholders have used these sections of the Flagship site to help inform their policy positions and advocacy during the annual meetings of the United Nations Climate Change Conference.
There are plans to include a map of regional ocean projects undertaken by SPC and its stakeholders on the PCCOS site.
If we have new features to contribute to the Climate Change Flagship or the PCCOS websites, I am sure it will be done through dashboards, not just by presenting raw data.
They can help people get data at a glance in a highly visual way. Dashboards are also quite easy to add to the site; we do not have to create any new interface.
For more information about the Pacific Data Hub, you can check out the case study here.